Indice
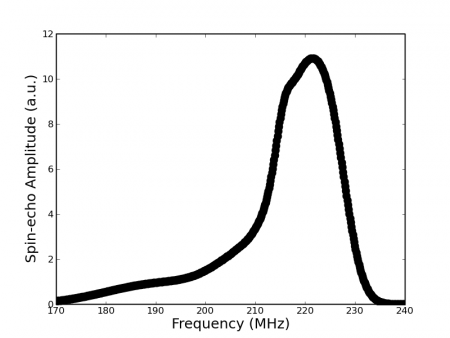
Zero-field 59Co NMR spectrum of LSMO/Alq3/AlOx/Co spin valve
Magnetic inhomogeneities in LSMO/Alq3/AlOx/Co spin valve
NMR fingerprint
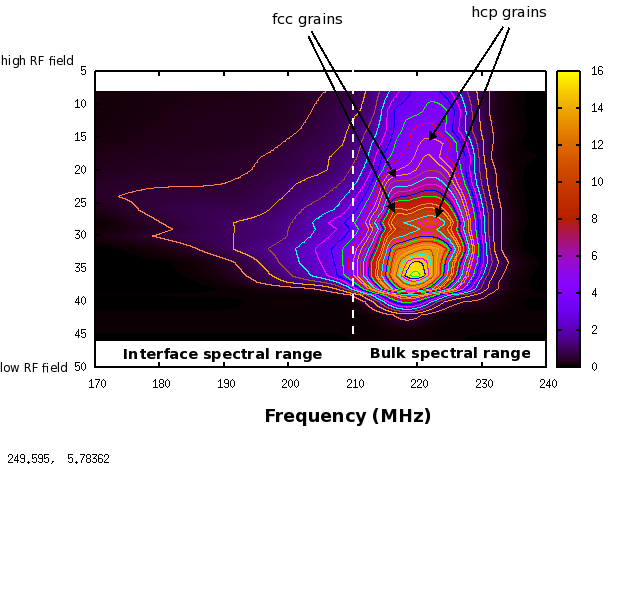
Contour plot of NMR intensity S(ω,Hrf) vs Frequency (MHz) and attenuation in dB (~ RF field) where
<math>S(\omega,H_{rf})=K \eta sin[\Theta (\eta H_{rf} \tau)]{\omega}^2 N(\omega) {\gamma}_{n} I(I+1)/T</math>
Such curves image directly the structural inhomogeneities, along the frequency axis, and the magnetic stiffness, along the RF filed axis. Considering that each frequency range is associated with a specific structure or region in a composite sample, the S(ω,Hrf) curves show the structural parameters governing, at atomic scale, the magnetic stiffness of the layers or parts of the layers and the coupling strength between layers.

